The survey
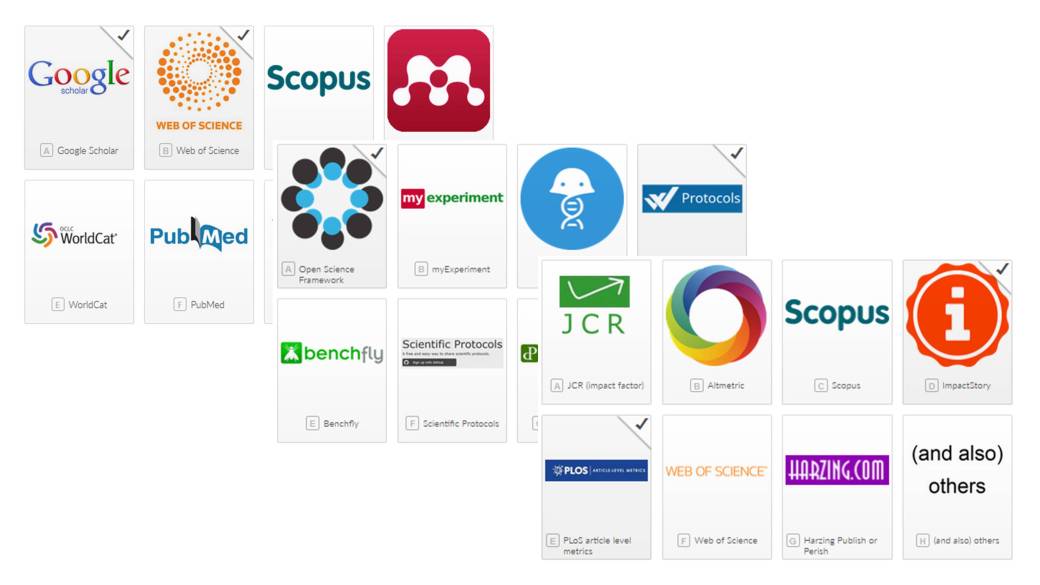
Our global survey is part of an ongoing effort to chart the changing landscape of scholarly communication. The changes in this landscape are driven by technology, policies, and culture, but in the end only take place because researchers and other stakeholders decide to adapt their workflows or recommend changes to others. Thus, the developing landscape is for an important part expressed through changing tool usage. New tools are constantly being developed by researchers themselves, small start-ups or big players, as reflected in our list of scholarly communication tools that now offers over 600 of these tools. However, tool usage varies by field, country and position. How exactly is what we intend to find out with this research.
The survey ran from May 10, 2015 to February 10, 2016. The separate questionnaire listing the tools mentioned in the survey is still available.
Response
Over 9 months, the survey received more than 20,000 responses. This is in large part thanks to the efforts of our custom-URL partners: >100 organisations (primarily universities and publishers) who distributed the survey among their researchers. The translation of the survey in 6 languages (with special thanks to our reviewers and testers!) has facilitated response from China, Japan, Russia, Latin-America and French- and Arab-speaking countries.
Data sharing
The (anonymized) survey data are available in various ways:
 |
 |
 |
 |
 |
| DATASET (Zenodo) |
DESCRIPTION (F1000Research) |
GRAPHS AND CHARTS (WordPress) |
SCRIPT SHARING (Kaggle) |
ANALYSIS IDEAS (GitHub repo) |
| Full dataset with raw (anonymized) and cleaned data files, variable list and original survey questions | Description of the dataset as a data publication. | Also see the interactive pivot template in Excel (9MB) for filtering and creating your own graphs | Build your R, Python or Julia scripts and start analyzing, share your scripts for others to build on | List of possible analysis ideas and results of two hackdays |
What you can do with the data
The data will make it possible to compare research workflows across the entire research cycle for different disciplines, research roles, countries and career lengths. The results also include the respondents’ stance on Open Access and Open Science, and on what they perceive to be the most important developments in scholarly communication.
Outreach and follow-up research
We presented the survey data and the most important insights at Force2016, April 17-19 in Portland, USA, and at various conferences and webinars since. We are continuing our own analyses on the data, and are planning a qualitative follow-up study with people who have indicated they are willing to be contacted again. In that we might take a deeper look at motivations for choosing more open, efficient and/or transparant ways of working. We welcome suggestions on topics to focus on in this follow up study.
Distribution partners
Over 100 institutions have partnered with us to make this survey a success and get institutionally tagged data. Our partners include:
 |
 |
 |
 |
 |
 |
| Brighton and Sussex NHS Library and Knowledge Service | Christian-Albrechts-Universität zu Kiel | Centre Hospitalier Regional Orléans | Dowling College, New York | East Carolina University, Greenville, NC | Erasmus MC Rotterdam |
 |
 |
 |
 |
 |
 |
| European Association of Health Information and Libraries (EAHIL) | European University Institute, Florence | George Mason University, Fairfax VA | Johns Hopkins University, Baltimore | Lake Winnipeg Basin Information Network, University of Manitoba | Ottawa Hospital Research Institute |
 |
 |
 |
 |
 |
|
| Pacific University Hillsboro, Portland | Springer Nature | St. Antonius Hospital, Nieuwegein | Technische Universität Dortmund | Universität Leipzig | University Medical Center Groningen |
 |
 |
 |
 |
 |
 |
| University of Cambridge | University of Colorado, Boulder | University of Edinburgh | University of Munster, Medical Faculty | Univerzita Pardubice | Utrecht University |
 |
 |
 |
 |
 |
|
| Vrije Universiteit Amsterdam | Institut Pasteur, Paris | Universidad Simón Bolívar, Caracas |
Technische Universität Dresden | BIU Santé, Paris | Wake Forest University, Winston-Salem |
 |
 |
 |
 |
||
| SciELO |
University of Salford, Manchester |
INRA, Paris |
PLOS | Technische Universität Hamburg-Harburg | F1000 |
 |
 |
 |
 |
 |
|
| Rowman & Littlefield |
EPFL, Lausanne |
MC Slotervaart, Amsterdam | Université Pierre et Marie Curie, Paris | College of the Bahamas, Nassau | Leiden University Medical Center |
 |
 |
 |
 |
 |
 |
| United Academics | Universidad de Sevilla | Aristotle University of Thessaloniki | University of Tennessee, Knoxville | Massachusetts Institute of Technology (MIT) | Wiley |
 |
 |
 |
 |
 |
 |
| Emerald | Hochschule Hannover | Hogeschool Arnhem Nijmegen | Vlerick Business School | University of Nigeria Nsukka | University of Pretoria |
 |
 |
 |
 |
 |
 |
| CSIR South Africa, Pretoria | California State University Channel Islands | The University of Northampton | Comunicar – Media Education Research Journal | Sage Publishing | Netherlands Cancer Institute, Amsterdam |
 |
 |
 |
 |
||
| Universiteit van Amsterdam | Hogeschool van Amsterdam | Universidad Pontifica Bolivariana | Universidade da Coruña | University of Oslo |
NB Distributions partners could choose whether or not to have their institution listed here.
