Green OA: publishers and journals allowing zero embargo and CC-BY

Jeroen Bosman and Bianca Kramer, Utrecht University, July 2020
Accompanying spreadsheet: https://tinyurl.com/green-OA-policies

Introduction

We witness increased interest in the role of green open access and how it can contribute to the goals of open science. This interest focuses on immediacy (reducing or eliminating embargoes) and usage rights (through open licenses), as these can contribute to wider and faster dissemination, reuse and collaboration in science and scholarship. 

On July 15 2020, cOAlition S announced their Rights Retention Strategy, providing authors with the right to share the accepted manuscript (AAM) of their research articles with an open license and without embargo, as one of the ways to comply with Plan S requirements. This raises the question to what extent immediate and open licensed self archiving of scholarly publications is currently already possible and practiced. Here we provide the results of some analyses carried out earlier this year, intended to at least partially answer that question. We limit this brief study to journal articles and only looked at CC-BY licenses (not CC0, CC-BY-SA and CC-BY-ND, which can also meet Plan S requirements).

Basically, there are two possible approaches to inventorize journals that currently allow immediate green archiving under a CC-BY license:

  • policy-based – by checking journal- or publisher policies, either directly or through Sherpa Romeo or Share Your Paper from Open Access Button.
  • empirically – by checking evidence for green archiving with 0 embargo and CC-BY license (with potential cross-check against policies to check for validity).

Here we only report on the first approach.

A full overview of journal open access policies and allowances (such as will be provided by the Journal Checker Tool that cOAlition S announced early July 2020) was beyond our scope here. Therefore, we carried out a policy check for a limited set of 36 large publishers to get a view of currently existing options for immediate green archiving with CC-BY license, supplemented with anecdotal data on journals that offer a compliant option. We also briefly discuss the potential and limitations of an empirical approach, and potential publisher motivations behind (not) allowing immediate sharing and sharing under a CC-BY license, respectively.

Our main conclusions are that:

  1. Based on stated policies we found very few (18) journals that currently allow the combination of immediate and CC-BY-licensed self archiving.
  2. Based on stated policies of 36 large publishers, there are currently ~2800 journals with those publishers that allow immediate green, but all disallow or do not explicitly allow CC-BY.

Large publishers – policies

We checked the 36 largest non-full-OA publishers, based on number of 2019 articles according to Scilit (which uses Crossref data), for self archiving policies allowing immediate sharing on (institutional) repositories. Of these 36 publishers, 18 have zero embargo allowances for at least some of their journals for green sharing of AAMs from subscription (incl. hybrid) journals in institutional or disciplinary repositories. Overall that pertains to at least 2785 journals. Elsevier only allows this in the form of updating a preprint shared on ArXiv or RePEc. From these large publishers, those with the most journals allowing zero embargo repository sharing are  Sage, Emerald, Brill,  CUP, T&F (for social sciences), IOS and APA. Notably, though not a large publisher in terms of papers or journals, the AAAS also allows immediate sharing through repositories.

None of these policies allow using a CC-BY license for sharing in repositories. Three explicitly mention another CC-license (NC or NC-ND), others do not mention licenses at all or ask authors to state that the copyright belongs to the publisher. Sometimes CC-licenses are not explicitly mentioned, but it is indicated that the AAM shared in repositories are for personal and/or non-commercial use only. 

For the data see columns F-H in the tab ‘Green OA‘ in the accompanying spreadsheet.

Other evidence

From the literature and news sources we know of a few examples of single publishers allowing zero embargo sharing in repositories combined with a CC-BY license:

  • ASCB:
    • Molecular Biology of the Cell (PV OA (CC-BY) after 2 months,
      AAM 0 embargo with CC-BY)
  • MIT Press:
    • Asian Development Review (full OA but PV has no open license)
    • Computational Linguistics (full OA but PV=CC-BY-NC-ND)
  • Microbiology Society
    • Microbiology
    • Journal of general Virology
    • Journal of medical Microbiology
    • Microbial genomics
    • International Journal of Systematic and Evolutionary Microbiology
    • JMM case reports
  • Royal Society
    • Biology Letters
    • Interface
    • Interface Focus
    • Notes and records
    • Philosophical Transactions A
    • Philosophical Transactions B
    • Proceedings A 
    • Proceedings B 

A check of the long tail of smaller publishers could yield additional examples of journals compliant with 0 embargo / CC-BY sharing from smaller publishers. 

Empirical analysis of green archiving

Empirical analysis of actual green archiving behaviour (e.g. using Unpaywall and/or Unpaywall data in Lens.org) could also provide leads to journals allowing early sharing.

Since Unpaywall data do not contain information on the date a green archived copy was made available in a repository, a direct empirical analysis of zero-embargo archiving is not readily possible. As a proxy, a selection could be made of articles published in a period of 3 months before a given database snapshot, and then identifying those that are only available as green OA. A period of 3 months, rather than 1 month or less, would allow for some delay in posting to a repository. 

The benefit of using Lens.org for such an analysis is the availability of a user-friendly public interface to perform queries in real time. The disadvantage is that, although Lens sources OA information from Unpaywall, no license information for green OA is included, and no distinction is made between submitted, accepted and published versions. Analyses could also be done on a snapshot of the Unpaywall database directly, which includes license information for green OA (where available) and provides version information.

Gap analysis report

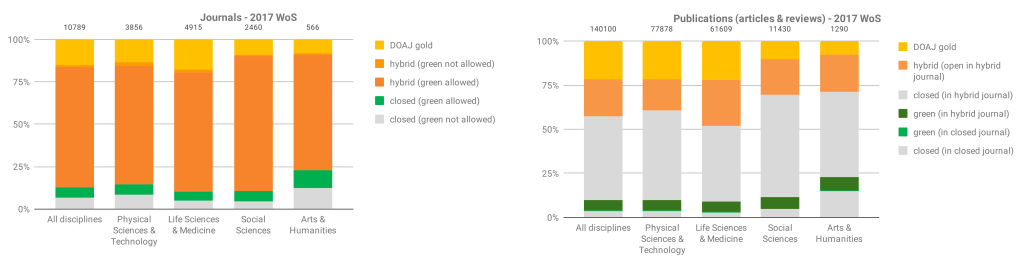
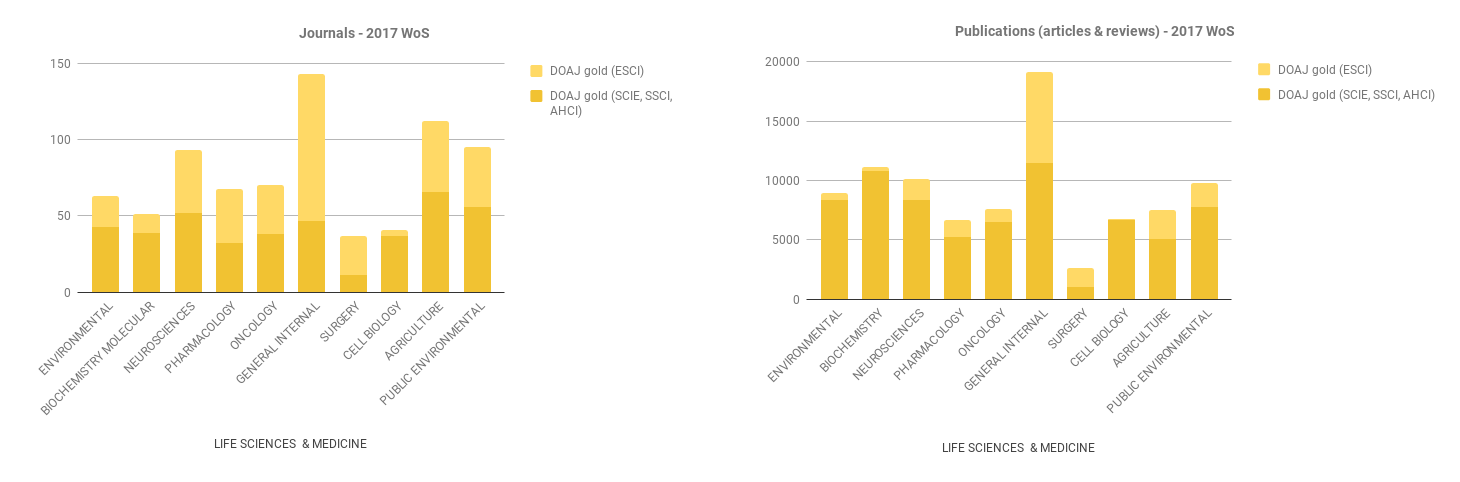
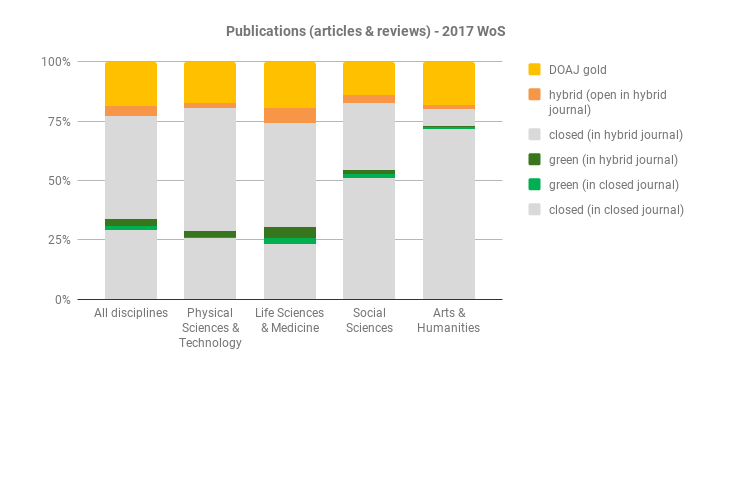
In our previous gap analysis report that gave a snapshot of publication year 2017, we did harvest policies from Sherpa Romeo systematically for the subset of journals included in the gap analysis (journals in Web of Science publishing articles resulting from Plan S-funded research). As explained above, updating this approach was beyond our scope for this exercise. 

In our original gap analysis data, we found no examples of journals that allowed 0 embargo in combination with CC-BY. 

Journal policies for green OA: embargo lengths and licenses
(source: Open access potential and uptake in the context of Plan S – a partial gap analysis)

Potential publisher motivations 

From checking policies and behaviour, different publisher approaches emerge regarding embargoes and licenses for self-archived article versions. It seems that the reluctance of publishers to allow immediate sharing is weaker overall than the reluctance to allow CC-BY for green OA. That may have to do with the reasons behind these two types of reluctance. 

The reason to not allow immediate sharing may concern fears of losing subscription income and perhaps also a dwindling effect on visitors to their platform. However, several publishers have noticed that this fear may be ungrounded, as libraries do not unsubscribe yet just because some percentage of articles is also immediately available as AAM, not only because of incomplete open availability but also because of the wish to provide access to published versions in their platform context. Some publishers (e.g. Sage) have also publicly stated that they do not witness a negative effect on subscriptions. 

For the reluctance to allow CC-BY licenses we expect other reasons to be at play, primarily the desire to be in control over how, where and in what form content is shared. This relates to  protecting income from derivative publications (reprints, printing-on-demand, anthologies etc.) and also to preventing others having any monetary gain from including content on competing platforms. 

Another aspect is the inability of publishers to require linking back to the publisher version in cases where the CC-BY licensed AAM in the repository is reused, rather than depending on community norms to provide information on and links to various versions of a publication.

Looking at the empirical evidence and these considerations, it can potentially be expected that across publishers, a move towards shorter embargoes might be easier to achieve than a move towards a fully open license for green-archived versions. It should be noted that while there are examples of publishers allowing shorter embargoes in response to specific funder mandates (e.g from Wellcome, NIH), to our knowledge there has not, prior to Plan S, been funder or institutional pressure to require open licenses for green archived AAMs. Thus, it will remain to be seen whether publishers would be inclined to move in this direction in response. The reactions to the letter cOAlition S sent to a large number of publishers to inform them on the cOAlition S Rights retention Strategy should provide clarity on that. 

In addition to funder policies, institutions and governments could further support this development through policies and legislation relating to copyright retention, as well as zero embargoes and licenses for green OA archiving of publications resulting from publicly funded research. This could provide authors with more rights and put pressure on publishers to seriously reconsider their stance on these matters. 

Open access potential and uptake in the context of Plan S – a partial gap analysis

Today we released the report Open access potential and uptake in the context of Plan S – a partial gap analysis, which aims to provide cOAlition S with initial quantitative and descriptive data on the availability and usage of various open access options in different fields and subdisciplines, and, as far as possible, their compliance with Plan S requirements. This work was commissioned on behalf of cOAlition S by the Dutch Research Council (NWO), a member of cOAlition S.

The reports builds on the work described in two of our 2018 posts: Towards a Plan S gap analysis? (1) Open access potential across disciplines and Towards a Plan S gap analysis? (2) Gold open access journals in WoS and DOAJ. The new report extends the methodology and range of data used, including more information on hybrid and green OA from Crossref, SHERPA/RoMEO, and Unpaywall directly Also, it provides more detail, with narrative sketches of publication cultures in 30 fields. In the appendix of the report, some other aspects of the open access landscape are addressed, such as journal size distribution and publisher types.

Uptake and potential of open access types in four main fields

Main results
Within the limitations of our approach using Web of Science (see below), the results show that in all main fields, including arts & humanities, over 75% of journals in our analysis do allow gold open access publishing. This currently consists predominantly of hybrid journals, which authors can only use in a Plan S compliant publishing route when the journal is part of a transformative arrangement or when authors also immediately share their article as green OA. The most striking result is the very large number of closed publications in hybrid journals, also given the fact that most of these journals do allow green open access.

Regarding licenses we find that a sizeable proportion (52%) of full gold OA journals already allow Plan S compliant licenses as well as copyright retention and importantly, that these journals are responsible for a large majority (78%) of articles published in full OA journals by cOAlition S fundees. Results on the green route to open access show that almost all hybrid journals and about half of the closed journals in our analysis do allow green OA archiving. In physical sciences & technology and life sciences & medicine, a 12 month embargo is most prevalent, with longer embargoes more common in social sciences and especially arts & humanities. At the same time, there are examples of journals with a 0 month embargo in all fields, and especially in social sciences these have a considerable share.

Overall, one could say that while there currently is limited compliance with the various Plan S requirements, there is huge variety among fields and at the same time also a lot of potential and opportunity.

Limitations of using Web of Science
We acknowledge the limitations of the report caused by using Web of Science as the sole source to identify cOAlition S-funded research output. The choice to use Web of Science relates to availability of funder information and field labels, that are essential in this analysis. However, apart from not being an open data source, relying on Web of Science inevitably introduces bias in disciplinary, geographical and language coverage, as well as in coverage of newer OA publication venues and many diamond OA venues. In this light, this report should be seen as a partial gap analysis only. In the appendix of the report, we provide an overview of characteristics of a number of other databases that influence their potential usage in analyses of OA options at funder or institutional level, as well as their coverage of social sciences and humanities specifically.

Feedback and next steps
The narrative sketches of a number of subdisciplines provided in the report are largely informed by the quantitative results of the report. It would be interesting to learn to what extent and how they reflect the image that researchers in these fields have of the availability and usage of open access options in their field, and how these are influenced by the publication culture in that field.

The report is intended as a first step: an exploration in methodology as much as in results. Subsequent interpretation (e.g. on fields where funder investment/action is needed) and decisions on next steps (e.g. on more complete and longitudinal monitoring of Plan S-compliant venues) is intentionally left to cOAlition S.

We want to thank our colleagues at Utrecht University Library for their contributions to this work. Any mistakes and omissions remain our responsibility.

The data underlying the report are shared at: https://doi.org/10.5281/zenodo.3549020

See also: press release by cOAlition S on the report.

Towards a Plan S gap analysis? (2) Gold open access journals in WoS and DOAJ

(NB this post is accompanied by a another post, on open access potential across disciplines, in the light of Plan S)

In our previous blogpost, we explored open access (OA)  potential (in terms of journals and publications) across disciplines, with an eye towards Plan S. For that exercise, we looked at a particular subset of journals, namely those included in Web of Science. We fully acknowledge this practical decision leads to limitation and bias in the results. In particular this concerns a bias against:

  • recently launched journals
  • non-traditional journal types
  • smaller journals not (yet) meeting the technical requirements of WoS
  • journals in languages other than English
  • journals from non-Western regions

To further explore this bias, and give context to the interpretation of results derived from looking at full gold OA journals in Web of Science only, we analyzed the inclusion of DOAJ journals in WoS per major discipline.

We also looked at the proportion of DOAJ journals (and articles/reviews therein) in different parts of the Web of Science Core Collection that we used: either in the Science Citation Index Expanded (SCIE) / Social Sciences Citation Index (SSCI) /Arts & Humanities Citation Index (AHCI), or in the Emerging Sources Citation Index (ESCI).

The Emerging Sources Citation Index contains a range of journals not (yet) indexed in the other citation indexes, including journals in emerging scientific fields and regional journals. It uses the same quality criteria for inclusion as the other citation indexes, notably: journals should be peer reviewed, follow ethical publishing practices, meet Web of Science’s technical requirements, and have English language bibliographic information. Journals also have to publish actively with current issues and articles posted regularly. Citation impact and a strict publication schedule is not a criterion for inclusion of journals in ESCI, which means that also newer journals can be part of ESCI. Journals in ESCI and the AHCI do not have a Clarivate impact factor.

Method
We compared the number of DOAJ journals in Web of Science to the total number of journals in DOAJ per discipline. For this, we made a mapping  of the LCC-classification used in DOAJ to the major disciplines used in Web of Science, combining Physical Sciences and Technology into one to get four major disciplines.

For a number of (sub)disciplines, we identified the number of full gold journals in Web of Science Core Collection, as well as the number of publications from 2017 (articles & reviews) in those journals. We also looked what proportion of these journals (and the publications therein) are listed in ESCI as opposed to SCIE/SSCI/AHCI. For subdisciplines in Web of Science, we identified 10 research areas in each major discipline with the highest number of articles & reviews in 2017. Web of Science makes use of data from Unpaywall for OA classification at article-level.

All data underlying this analysis are available on Zenodo: https://doi.org/10.5281/zenodo.1979937

Results

Looking at the total number of journals in DOAJ and the proportion thereof included in Web of Science (Fig 1, Table 1) shows that Web of Science covers only 32% of journals in DOAJ, and 66% of those are covered in ESCI. For Social Sciences and Humanities, the proportion of DOAJ journals included in WoS is only 20%, and >80% of these journals are covered in ESCI, not SSCI/AHCI. This means that only looking at WoS leaves out 60-80% of DOAJ journals (depending on discipline), and only looking at the ‘traditional’ citation indexes SCIE/SSCI/AHCI restricts this even further.

Gold all 0

Fig 1. Coverage of DOAJ journals in WoS

DOAJ-WoS table.png

Table 1. Coverage of DOAJ journals in WoS (percentages)

We then compared the the proportion of DOAJ journals covered in SCIE/SSCI/AHCI versus ESCI, to the proportion of publications in those journals in the two sets of citation indexes (Fig 3). This reveals that for Physical Sciences & Technology and for Life Sciences & Medicine, the majority of full gold OA articles in WoS is published in journals included in SCIE, indicating that journals in ESCI might predominantly be smaller, lower volume journals. For Social Sciences and for Humanities, however, journals in ESCI account for the majority of gold OA articles in WoS. This means that due to WoS indexing practices, a large proportion of gold OA articles in these disciplines is excluded when considering only what’s covered in SSCI and AHCI.

Gold all 1-2 large

Fig 2. Gold OA journals and publications in WoS

The overall patterns observed for the major disciplines can be explored more in detail when looking at subdisciplines (Fig 3). Here, some interesting differences between subdisciplines within a major discipline emerge.

  • In Physical Sciences and Technology, three subdisciplines (Engineering, Mathematics and Computer Sciences) have a large proportion of full OA journals that is covered in ESCI rather than SCIE, and especially for Engineering, these account for a sizeable part of full gold OA articles in that subdiscipline.
  • In Life Sciences and Biomedicine,  General and Internal Medicine seems to be an exception with both the largest proportion  of full OA journals in ESCI as well as the largest share of full gold OA publications coming from these journals. In contrast, in Cell Biology, virtually all full gold OA publications are from journals included in SCIE.
  • In Social Sciences, only in Psychology a majority of full gold OA publications is in journals covered in SSCI, even though for this discipline, as for all other in Social Sciences, the large majority of full gold OA journals is part of ESCI, not SSCI.
  • In Arts & Humanities the pattern seems to be consistent across subdisciplines, perhaps with the exception of Religion, which seems to have a relatively large proportion of articles in AHCI journals, and Architecture, where virtually all journals (and thus, publications) are in ESCI, not AHCI.

Gold PT 1-2 large
Gold LM 1-2 large
Gold SOC 1-2 large

Gold AH 1-2 large

Fig 3. Full gold OA journals and publications in Web of Science, per subdiscipline

Looking beyond traditional citation indexes

Our results clearly show that in all disciplines, the traditional citation indexes in WoS (SCIE, SSCI and AHCI) cover only a minority of existing full gold OA journals. Looking at publication behaviour, journals included in ESCI account for a large number of gold OA publications in many (sub)disciplines, especially in Social Sciences and Humanities. Especially in terms of an analysis of availability of full OA publication venues in the context of Plan S, it will be interesting to look closer at titles included in both SCIE/SSCI/AHCI and  ESCI per (sub)discipline and assess the relevance of these titles to different groups of researchers within that discipline (for instance by looking at publication volume, language, content from cOAlitions S or EU countries, readership/citations from cOAlition S or EU countries). Looking at publication venues beyond traditional citation indexes fits well with the ambition of Plan S funders to move away from evaluation based on journal prestige as measured by impact factors. It should also be kept in mind that ESCI marks but a small extension of coverage of full gold OA journals, compared to the large part of DOAJ journals that are not covered by WoS at all.

Encore: Plan S criteria for gold OA journals

So far, we have looked at coverage of all DOAJ journals, irrespective of whether they meet specific criteria of Plan S for publication in full OA journals and platforms, including copyright retention and CC-BY license*.

Analyzing data available through DOAJ (supplemented with our mapping to WoS major disciplines) shows that currently, 28% of DOAJ journals complies with these two criteria (Fig 4). That proportion is somewhat higher for Physical Sciences & Technology and Life Sciences & Medicine, and lower for Social Sciences & Humanities. It should be noted that when a journal allows multiple licenses (e.g. CC-BY and CC-BY-NC-ND), DOAJ includes only the most strict license in its journal list download. Therefore, the percentages shown here for compliant licensing are likely an underestimation. Furthermore, we want to emphasize that this analysis reflects the current situation, and thereby could also be thought of as pointing towards the potential of available full OA venues if publishers adapt their policies on copyright retention and licensing to align with criteria set out in Plan S.

Copyright criteria (CC-BY and copyright retention) of DOAJ journals_empty

Fig 4. Copyright criteria (CC-BY and copyright retention) of DOAJ journals

*The current implementation guidance also indicated that CC-BY-SA and CC0 would be acceptable. These have not been included in our analysis (yet).

Towards a Plan S gap analysis? (1) Open access potential across disciplines

(NB this post is accompanied by a second post on presence of full gold open access journals in Web of Science and DOAJ)

In the proposed implementation guidelines for Plan S, it has become clear there will be, for the coming years at least, three ways to open access (OA) that are compliant with Plan S:

  • publication in full open access journals and platforms
  • deposit in open access repositories of author accepted manuscript (AAM) or publisher version (VOR)
  • publishing in hybrid journals that are part of transformative agreements

Additional requirements concern copyright (copyright retention by authors or institutions), licensing (CC-BY, CC-BY-SA or CC0), embargo periods (no embargo’s) and technical requirements for open access journals, platforms and repositories.

In the discussion surrounding plan S, one of the issues that keeps coming back is how many publishing venues are currently compliant. Or, phrased differently, how many of their current publication venues researchers fear will no longer be available to them.

However, the current state should be regarded as a starting point, not the end point. As Plan S is meant to effect changes in the system of scholarly publication, it is important to look at the potential for moving towards compliance, both on the side of publishers as well as on the side of authors.

https://twitter.com/lteytelman/status/1067635233380429824

Method
To get a first indication as to what that potential for open access is across different disciplines, we looked at a particular subset of journals, namely those in Web of Science. For this first approach we chose Web of Science because of its multidisciplinary nature, because it covers both open and closed journals, because it has open access detection and because it offers subject categories and finally, because of its functionality in generating and exporting frequency tables of journal titles. We fully recognize the inevitable bias related to using Web of Science as source, and address this further below and in an accompanying blogpost.

For a number of (sub)disciplines, we identified the proportion of full gold, hybrid and closed journals in Web of Science, as well as the proportion of hybrid and closed journals that allows green open access by archiving AAM/VOR in repositories.  We also looked at the number of publications from 2017 (articles & reviews) that were actually made open access (or not) under each of these models.

Some methodological remarks:

  • We used the data available in Web of Science for OA classification at the article level. WoS uses Unpaywall data but imposes its own classification criteria:
    • DOAJ gold: article in journal included in DOAJ
    • hybrid: article in non-DOAJ journal, with CC-license
      (NB This excludes hybrid journals that use a publisher-specific license)
    • green: AAM or VOR in repository 
  • For journal classification we did not use a journal list, but we classified a journal as gold, hybrid and/or allowing green OA if at least one article from 2017 in that journal was classified as such. This method may underestimate:
    • journals allowing green OA in fields with long embargo’s (esp. A&H)
    • journals allowing hybrid or green OA if those journals have very low publication volumes (increasing the chance that a certain route is not used by any 2017 paper)
  • We only looked at green OA for closed articles, i.e. when articles were not also published OA in a gold or hybrid journal.
  • Specific plan S criteria are not (yet) taken into account in these data, i.e. copyright retention, CC-BY/CC-BY-SA/CC0 license, no embargo period (for green OA) and being part of transformative agreements (for hybrid journals)
  • For breakdown across (sub)disciplines, we used WoS research areas (which are assigned at the journal level). We combined Physical Sciences and Technology into one to get four major disciplines. In each major discipline, we identified 10 subdisciplines  with the highest number of articles & reviews in 2017 ((excluding ‘other topics’ and replacing Astronomy & Astrophysics for Mechanics because of specific interest in green OA in Astronomy & Astrophysics)
  • We used the full WoS Core collection available through our institution’s license, which includes the Science Citation Index Expanded (SCIE), the Social Sciences Citation Index (SSCI), the Arts & Humanities Citation Index (AHCI) and the Emerging Sources Citation Index (ESCI).

All data underlying this analysis are available on Zenodo:
https://doi.org/10.5281/zenodo.1979937

Results

As seen in Figure 1A-B, the proportion of full gold OA journals is relatively consistent  across major disciplines, as is the proportion of articles published in these journals. Both are between 15-20%. Despite a large proportion of hybrid journals in Physical Sciences & Technology and Life Sciences & Medicine, the actual proportion of articles published OA in hybrid journals is quite low in all disciplines. The majority of hybrid journals (except in Arts & Humanities) allow green OA, as do between 30-45% of closed journals (again except in Arts&Humanities). However, the actual proportion of green OA at the article level is much lower. As said, embargo periods (esp. those exceeding 12 months) might have an overall effect here, but the difference between potential and uptake remains striking.

https://101innovations.files.wordpress.com/2018/11/all1.png

All2

Fig 1A-B. OA classification of journals and publications (Web of Science, publication year 2017)

Looking at subdisciplines reveals interesting differences both in the availability of open access options and the proportion of articles & reviews using these options (Fig 2).

  • In Physical Sciences and Technology, the percentage of journals that is fully gold OA is quite low in most fields, with slightly higher levels in energy fuels, geology, optics and astronomy. Uptake of these journals is lower still, with only the optics and geology fields slightly higher. Hybrid journals are numerous in this discipline but see their gold and green open access options used quite infrequently. The use of green OA for closed journals, where allowed, is also limited, with the exception of astronomy.  (but note that green sharing of preprints is not included in this analysis). In all fields in this discipline over 25% of WoS indexed journals seem to have no open options at all. Of all subdisciplines in our analysis, those in the  physical sciences fields display the starkest contrast between the ample OA options and their limited usage.
  • In Life Sciences & Biomedicine, penetration of full gold OA journals  is higher than in Physical sciences, but with starker differences, ranging from very low levels in environmental science and molecular biochemistry to much higher levels for general internal medicine and agriculture. In the Life sciences and Biomedicine discipline, uptake of gold OA journals is quite good, again especially in general internal medicine. Availability of hybrid journals is quite high but their use is limited; exceptions are cell biology and cancer studies that do show high levels of open papers in hybrid journals. Green sharing is a clearly better than in Physical sciences, especially in fields like neurosciences, oncology and cell biology (likely also due to PMC / EuropePMC) but still quite low given the amount of journals allowing it.
  • In Social Sciences there is a large percentage of closed non-hybrid subscription journals, but many allow green OA sharing. Alas the uptake of that is limited, as far as detected using Unpaywall data. In this regard the one exception is psychology, with a somewhat higher level of green sharing. Hybrid OA publishing is available less often than in Physical Sciences or Life Sciences, but with relatively high shares in psychology, sociology, geography and public administration. The fields with the highest shares of full gold OA journals are education, linguistics, geography and communication, with usage of gold in Social Sciences more or less corresponding with full gold journal availability.
  • In Arts & Humanities, the most striking fact is the very large share of journals offering no open option at all. Like in Social Sciences, usage of gold across Humanities fields more or less corresponds with full gold journal availability. Hybrid options are limited and even more rarely used, except in philosophy fields. Green sharing options are already limited, but their use is even lower.

PT 1-2 large

LM 1-2 largeSOC 1-2 large

AH 1-2 large

Fig 2. OA classification of journals and publications in different subdisciplines (Web of Science, publication year 2017)

Increasing Plan-S compliant OA 

Taking these data as a starting point (and taking into account that the proportion of Plan S compliant OA will be lower than the proportions of OA shown here, both for journals and publications), there are a number of ways in which both publishers and authors can increase Plan S-compliant OA (see Fig 3):

  • adapt journal policies to make existing journals compliant
    (re: license, copyright retention, transitional agreements, 0 embargo)
  • create new journals/platforms or flip existing journals to full OA (preferably diamond OA)
  • encourage authors to make use of existing OA options (by mandates, OA funding (including for diamond OA) and changes in evaluation system)

We also made a more detailed analysis of nine possible routes towards plan S-compliance (including potential effects on various stakeholders) that might be of interest here.

Towards compliancy

Fig 3. Ways to increase Plan S-compliant OA

Towards a gap analysis? Some considerations

In their implementation guidance, cOAlition S states it will commission a gap analysis of Open Access journals/platforms to identify fields and disciplines where there is a need to increase their share. In doing so, we suggest it would be good to not only look at the share of currently existing gold OA journals/platforms, but view this in context of the potential to move towards plan S compliance, both on the side of publishers and authors. Filling any gaps could thus involve supporting new platforms, but also supporting flipping of hybrid/closed journals and supporting authors in making use of these options, or at least considering the effect of the latter two developments on the expected gap size(s).

Another consideration in determining gaps is whether to look at the full landscape of (Plan S-compliant) full gold journals and platforms, or whether to make a selection based on relevance or acceptability to plan S-funded authors, e.g.  by impact factor, by inclusion in an ‘accepted journal list’ (e.g. the Nordic list(s) or the ERA-list) or by other criteria. In our opinion, any such selection should be presented as an optional overlay/filter view, and preferably be based on criteria other than journal prestige, as this is exactly what cOAlition S wants to move away from in the assessment of research.  Some more neutral criteria that could be considered are:

    • Language: English and/or at least one EU language accepted?
    • Content from cOAlition S or EU countries?
    • Readership/citations from cOAlition S or EU countries?
    • Editorial board (partly) from cOAlition S or EU countries?
    • Volume (e.g. papers per annum)

Of course we ourselves already made a selection by using WoS, and we fully recognize this practical decision leads to limitation and bias in the results. For a further analysis of inclusion of DOAJ journals in WoS per discipline, as well as the proportion of DOAJ journals in ESCI vs SCIE/SSCI/AHCI, see the accompanying blogpost ‘Gold OA journals in WoS and DOAJ‘.

To further explore bias in coverage, there are also other journal lists that might be worthwhile to compare (e.g. ROAD, EZB, JournalTOCs, Scopus sources list). Another interesting initiative in this regard is the ISSN-GOLD-OA 2.0 list that provides a matching list of ISSN for Gold Open Access (OA) journals from DOAJ, ROAD, PubMed Central and the Open APC initiative. It is especially important to ensure that existing (and future) publishing platforms, diamond OA journals and overlay journals will be included in any analysis of gold OA publishing venues. One initiative in this area is the crowdsourced inventarisation of (sub)areas within mathematics where there is the most need for Fair Open Access journals.

There are multiple ways in which the rough analysis presented here could be taken further. First, a check on specific Plan S compliant criteria could be added, i.e. on CC-license type, copyright retention, embargo terms, and potentially on inclusion of hybrid journals in transitional agreement. Many of these (though not the latter) could be derived from existing data, e.g. in DOAJ and SherpaRomeo. Furthermore, an analysis such as this would ideally be based on fully open data. While not yet available in one interface that enables the required filtering, faceting and export functionality,  a combination of the following sources would be interesting to explore:

  • Unpaywall database (article, journal, publisher and repository info, OA detection)
  • LENS.org (article, journal, affiliation and funder info, integration with Unpaywall)
  • DOAJ (characteristics of full gold OA journals)
  • SherpaRomeo (embargo information)

Ultimately, this could result in an open database that would allow multiple views on the landscape of OA publication venues and the usage thereof, enabling policy makers, service providers (including publishers) and authors alike to make evidence-based decisions in OA publishing. We would welcome an open (funding) call from cOAlition S funders to get people together to think and work on this.


Stringing beads: from tool combinations to workflows

[update 20170820: the interactive online table now includes the 7 most often mentioned ‘other’ tools for each question, next to the 7 preset choices. See also heatmap, values and calculations for this dataset]

With the data from our global survey of scholarly communication tool usage, we want to work towards identifying and characterizing full research workflows (from discovery to assessment).

Previously, we explained the methodology we used to assess which tool combinations occur together in research workflows more often than would be expected by chance. How can the results (heatmap, values and calculations) be used to identify real-life research workflows? Which tools really love each other, and what does that mean for the way researchers (can) work?

Comparing co-occurences for different tools/platforms
First of all, it is interesting to compare the sets of tools that are specifically used together (or not used together) with different tools/platforms. To make this easier, we have constructed an interactive online table (http://tinyurl.com/toolcombinations, with a colour-blind safe version available at http://tinyurl.com/toolcombinations-cb) that allows anyone to select a specific tool and see those combinations. For instance, comparing tools specifically used by people publishing in journal from open access publishers vs. traditional publishers (Figure 1,2) reveals interesting patterns.

For example, while publishing in open access journals is correlated with the use of several repositories and preprint servers (institutional repositories, PubMedCentral and bioRxiv, specifically), publishing in traditional journals is not. The one exception here is sharing publications through ResearchGate, an activity that seems to be positively correlated with publishing regardless of venue….

Another interesting finding is that while both people who publish in open access and traditional journals specifically use the impact factor and Web of Science to measure impact (again, this may be correlated with the activity of publishing, regardless of venue), altmetrics tools/platforms are used specifically by people publishing in open access journals. There is even a negative correlation between the use of Altmetric and ImpactStory and publishing in traditional journals.

Such results can also be interesting for tool/platform providers, as it provides them with information on other tools/platforms their users employ. In addition to the data on tools specifically used together, providers could also use absolute numbers on tool usage to identify tools that are popular, but not specifically used with their own tool/platform (yet). This could identify opportunities to improve interoperability and integration of their own tool with other tools/platforms. All data are of course fully open and available for any party to analyze and use.

tool-combinations-079-topical-journal-oa-publisher

Figure 1. Tool combinations – Topical journal (Open Access publisher)

Tool combinations 078 - Topical journal Trad publisher.jpg

Figure 2. Tool combinations – Topical journal (traditional publisher)

Towards identifying workflows: clusters and cliques
The examples above show that, although we only analyzed combinations of any two tools/platforms so far, these data already bring to light some interesting differences between research workflows. There are several possibilities to extend this analysis  from separate tool combinations into groups of tools typifying full research workflows. Two of these possibilities are looking at clusters and cliques, respectively.

1. Clusters: tools occurring in similar workflows
Based on our co-occurrence data, we can look at which tools occur in similar workflows, i.e. have the most tools in common that they are or are not specifically used with. This can be done in R using a clustering analysis script provided by Bastian Greshake (see GitHub repo with code, source data and output). When run with our co-occurrence data, the script basically sorts the original heatmap with green and red cells by placing tools that have a similar pattern of correlation with other tools closer together (Figure 3). The tree structure on both sides of the diagram indicates the hierarchy of tools that are most similar in this respect.

survey_heatmap_p-values_2-tailed_coded_RG_white_AB.png

Figure 3. Cluster analysis of tool usage across workflows (click on image for larger version). Blue squares A and B indicate clusters highlighted in Figure 4. A color-blind safe version of this figure can be found here.

Although the similarities (indicated by the length of the branches in the hierarchy tree, with shorter lengths signifying closer resemblance) are not that strong, still some clusters can be identified. For example, one cluster contains popular, mostly traditional tools (Figure 4A) and another cluster contains mostly innovative/experimental tools, that apparently occur in similar workflows together. (Figure 4B).

clusters_examples

Figure 4. Two examples of clusters of tools (both clusters are highlighted in blue in Figure 3).

2. Cliques: tools that are linked together as a group
Another approach to defining workflows is to identify groups of tools that are all specifically used with *all* other tools in that group. In network theory, such groups are called ‘cliques’. Luckily, there is a good R-library (igraph) for identifying cliques from co-occurrence data. Using this library (see GitHub repo with code, source data and output) we found that the largest cliques in our set of tools consist of 17 tools . We identified 8 of these cliques, which are partially overlapping. In total, there are over 3000 ‘maximal cliques’ (cliques that cannot be enlarged) in our dataset of 119 preset tools, varying in size from 3 tot 17 tools. So there is lots to analyze!

An example of one of the largest cliques is shown in Figure 5. This example shows a workflow with mostly modern and innovative tools, with an emphasis on open science (collaborative writing, sharing data, publishing open access, measuring broader impact with altmetrics tools), but surprisingly, these tools are apparently also all used together with the more traditional ResearcherID. A hypothetical explanation might be that this represents the workflow of a subset of people actively aware of and involved in scholarly communication, who started using ResearcherID when there was not much else, still have that, but now combine it with many other, more modern tools.

cliques-example_colors

Figure 5. Example of a clique: tools that all specifically co-occur with each other

Clusters and cliques: not the same
It’s important to realize the difference between the two approaches described above. While the clustering algorithm considers similarity in patterns of co-occurrences between tools, the clique approach identifies closely linked groups of tools, that can, however, each also co-occur with other tools in workflows.

In other words, tools/platform that are clustered together occur in similar workflows, but do not necessarily all specifically occur together (see the presence of white and red squares in Figure 4A,B). Conversely, tools that do all specifically occur together, and thus form a clique, can appear in different clusters, as each can have a different pattern of co-occurrences with other tools (compare Figures 3/5).

In addition, it is worth noting that these approaches to identifying workflows are based on statistical analysis of aggregated data – thus, clusters or cliques do not necessarily have an exact match with individual workflows of survey respondents.Thus we are not describing actual observed patterns, but are inferring patterns based on observed strong correlations of pairs of tools/platforms.

Characterizing workflows further – next steps
Our current analyses of tool combinations and workflows are based on survey answers from all participants, for the 119 preset tools in our survey. We would like to extend these analyses to include tools most often mentioned by participants as ‘others’. We also want to focus on differences and similarities of workflows of specific subgroups (e.g. different disciplines, research roles and/our countries). The demographic variables in our public dataset (on Zenodo or Kaggle) allow for such breakdowns, but it would require coding an R script to generate the co-occurrence probabilities for different subgroups. And finally, we can add variables to the tools, for instance , classifying which tools support open research practices and which don’t. This then allows us to investigate to which extent full Open Science workflows are not only theoretically possible, but already put into practice by researchers.

See also our short video, added below:

header image: Turquoise Beads, Circe Denyer, CC0, PublicDomainPictures.net

Academic social networks – the Swiss Army Knives of scholarly communication

On December 7, 2016, at the STM Innovations Seminar  we gave a presentation (available from Figshare) on academic social networks. For this, we looked at the functionalities and usage of three of the major networks (ResearchGate, Mendeley and Academia.edu) and also offered some thoughts on the values and choices at play both in offering and using such platforms.

Functionalities of academic social networks
Academic social networks support activities across the research cycle, from getting job suggestions, sharing and reading full-text papers to following use of your research output within the system. We looked at detailed functionalities offered by ResearchGate, Mendeley and Academia.edu (Appendix 1) and mapped these against seven phases of the research workflow (Figure 1).

In total, we identified 170 functionalities, of which 17 were shared by all three platforms. The largest overlap between ResearchGate and Academia lies in functionalities for discovery and publication (a.o. sharing of papers), while for outreach and assessment, these two platforms have many functionalities that do not overlap. Some examples of unique functionalities include publication sessions (time-limited feedback sessions on one of your full text papers) and making metrics public or private in Academia, and Q&A’s, ‘enhanced’ full-text views and downloads and the possibility to add additional resources to publications in ResearchGate. Mendeley is the only platform offering  reference management and specific functionality for data storage, according to FAIR principles. A detailed list of all functionalities identified can be found in Appendix 1.

functionalities_euler

Figure 1. Overlap of functionalities of ResearchGate, Mendeley and Academia in seven phases of the research cycle

Within the seven phases of the research cycle depicted above, we identified 31 core research activities. If the functionalities of ResearchGate, Mendeley and Academia are mapped against these 31 activities (Figure 2), it becomes apparent that Mendeley offers the most complete support of discovery, which ResearchGate supports archiving/sharing of the widest spectrum of research output. All three platforms support outreach and assessment activities, including impact metrics.

functionalities_31activities

Figure 2. Mapping of functionalities of ResearchGate, Mendeley and Academia against 31 activities across the research worflow

What’s missing?
Despite offering 170 distinct functionalities between them, there are still important functionalities that are missing from the three major academic social networks. For a large part, these center around integration with other platforms and services:

  • Connect to ORCID  (only in Mendeley), import from ORCID
  • Show third party altmetrics
  • Export your publication list (only in Mendeley)
  • Automatically show and use clickable DOIs (only in Mendeley)
  • Automatically link to research output/object versions at initial publication platforms (only in Mendeley)

In addition, some research activities are underserved by the three major platforms. Most notably among these are activities in the analysis phase, where functionality to share notebooks and protocols might be a useful addition, as would text mining of full-text publications on the platform. And while Mendeley offers extensive reference management options, support for collaborative writing is currently not available on any of the three platforms.

If you build it, will they come?
Providers of academic social networks clearly aim to offer researchers a broad range of functionalities to support their research workflow. But which of these functionalities are used by which researchers? For that, we looked at the data of 15K researchers from our recent survey on scholarly communication tool usage. Firstly, looking at the question on which researcher profiles people use (Figure 3), it is apparent that of the preselected options, ResearchGate is the most popular. This is despite the factor that overall Academia.edu report a much higher number of accounts (46M compared to 11M for ResearchGate). One possible explanation for this discrepancy could be a high number of lapsed or passive accounts on Academia.edu – possibly set up by students.

survey_profiles

Figure 3. Survey question and responses (researchers only) on use of researcher profiles. For interactive version see http://dashboard101innovations.silk.co/page/Profiles

Looking  a bit more closely at the use of ResearchGate and Academia in different disciplines (Figure 4), ResearchGate proves to be dominant in the ‘hard’ sciences, while Academia is more popular in Arts & Humanities and to a lesser extent in Social Sciences and Economics. Whether this is due to the specific functionalities the platforms offer, the effect of what one’s peers are using or even to the name of the platforms (with researchers from disciplines identifying more with the term ‘Research’ than ‘Academia’ or vice versa) is up for debate.

survey_profiles_disciplines

Figure 4. Percentage of researchers in a given disicpline that indicate using ResearchGate and/or Academia (survey data)

If they come, what do they do?
Our survey results also give some indication as to what researchers are using academic social networks for. We had ResearchGate and Mendeley as preset answer options in a number of questions about different research activities, allowing a quantitative comparison of the use of these platforms for these specific activities (Figure 5). These results show that of these activities, ResearchGate is most often used as researcher profile, followed by its use for getting access to publications and sharing publications, respectively. Mendeley was included as preset answer option for different activities; of these, it is most often used for research management, following by reading/viewing/annotating and searching for literature/data. The results also show that for each activity it was presented as a preset option for, ResearchGate is used by most often by postdocs, while Mendeley is predominantly used by PhD students. Please note that these results do not allow a direct comparison between ResearchGate and Mendeley, except for the fourth activity in both charts: getting alerts/recommendations.

survey_presetactivities.jpg

Figure 5. Percentage of researchers using ResearchGate / Mendeley for selected research activities (survey data)

In addition to choosing tools/platforms presented as preset options, survey respondents could also indicate any other tools they use for a specific activity. This allows us to check for which other activities people use any of the academic social networks, and plot these against the activities these platforms offer functionalities for. The results are shown in Figure 6 and indicate that, in addition to activities supported by the respective platforms, people also carry out activities on social networks for which there are no dedicated functionalities. Some examples are using Academia and ResearchGate for reference management, and sharing all kinds of research outputs, including formats not specifically supported by  the respective networks. Some people even indicate using Mendeley for analysis – we would love to find out what type of research they are carrying out!

For much more and alternative data on use of these platforms’ functionalities please read the analyses by Ortega (2016), based on scraping millions of pages in these systems.

survey__reported_activities

Figure 6. Research ctivities people report using ResearchGate, Mendeley and/or Academia for (survey data)

Good, open or efficient? Choices for platform builders and researchers
Academic social networks are built for and used by many researchers for many different activities. But what kind of scholarly communication do they support? At Force11, the Scholarly Communications Working Group (of which we both are steering committee members) has been working on formulating principles for scholarly communication that encourage open, equitable, sustainable, and research- and culture-led (as opposed to technology- and business-model led) scholarschip.

This requires, among other things, that research objects and all information about them can be freely shared among different platforms, and not be locked into any one platform. While Mendeley has an API  they claim is fully open,  both ResearchGate and Academia are essentially closed systems. For example, all metrics remain inside the system (though Academia offers an export to csv that we could not get working) and by uploading full text to ResearchGate you grant them the right to change your PDFs (e.g. by adding links to cited articles that are also in ResearchGate).

There are platforms that operate from a different perspective, allowing a more open flow of research objects. Some examples are the Open Science Framework, F1000 (with F1000 Workspace), ScienceOpen, Humanities Commons and GitHub (with some geared more towards specific disciplines). Not all platforms support all the same activities as ResearchGate and Academia (Figure 7), and there are marked differences in the level of support for activities: sharing a bit of code through ResearchGate is almost incomparable to the full range of options for this at GitHub. All these platforms pose alternatives for researchers wanting to conduct and share their research in a truly open manner.

functionalities_open_networks

Figure 7. Alternative platforms that support research in multiple phases of the research cycle

Reading list
Some additional readings on academic social networks and their use:

Appendix 1
List of functionalities within ResearchGate, Mendeley and Academia (per 20161204). A live, updated version of this table can be found here: http://tinyurl.com/ACMERGfunctions.

functionalities-list-total

Appendix 1. Detailed functionalities of ResearchGate, Mendeley and Academia per 20161204. Live, updated version at http://tinyurl.com/ACMERGfunctions

Tools that love to be together

[updates in brackets below]
[see also follow-up post: Stringing beads: from tool combinations to workflows]

Our survey data analyses so far have focused on tool usage for specific research activities (e.g. GitHub and others: data sharing, Who is using altmetrics tools, The number games). As a next step, we want to explore which tool combinations occur together in research workflows more often than would be expected by chance. This will also facilitate identification of full research workflows, and subsequent empirical testing of our hypothetical workflows against reality.

Checking which tools occur together more often than expected by chance is not as simple  as looking which tools are most often mentioned together. For example, even if two tools are not used by many people, they might still occur together in people’s workflows more often than expected based on their relatively low overall usage. Conversely, take two tools that each are used by many people: stochastically, a sizable proportion of those people will be shown to use both of them, but this might still be due to chance alone.

Thus, to determine whether the number of people that use two tools together is significantly higher than can be expected by chance, we have to look at the expected co-use of these tools given the number of people that use either of them. This can be compared to the classic example in statistics of taking colored balls out of an urn without replacement: if an urn contains 100 balls (= the population) of which 60 are red (= people in that population who use tool A), and from these 100 balls a sample of 10 balls is taken (= people in the population who use tool B), how many of these 10 balls would be red (=people who use both tool A and B)? This will vary with each try, of course, but when you repeat the experiment many times, the most frequently occurring number of red balls in the sample will be 6. The stochastic distribution in this situation is the hypergeometric distribution.

memrise-heatmap

Figure 1. Source: Memrise

For any possible number x of red balls in the sample (i.e. 1-10), the probability of result x occurring at any given try can be calculated with the hypergeometric probability function. The cumulative hypergeometric probability function gives the probability that the number of red balls in the sample is x or higher. This probability is the p-value of the hypergeometric test (identical to the one-tailed Fisher test), and can be used to assess whether an observed result (e.g. 9 red balls in the sample) is significantly higher than expected by chance. In a single experiment as described above, a p-value of less than 0.05 is commonly considered significant.

In our example, the probability of getting at least 9 red balls in the sample is 0.039 (Figure 2).  Going back to our survey data, this translates to the probability that in a population of 100 people, of which 60 people use tool A and 10 people use tool B, 9 or more people use both tools.

hg-calculation-example

Figure 2 Example of hypergeometric probability calculated using GeneProf.

In applying the hypergeometric test to our survey data, some additional considerations come into play.

Population size
First, for each combination of two tools, what should be taken as total population size (i.e. the 100 balls/100 people in the example above)? It might seem intuitive that that population is the total number of respondents (20,663 for the survey as a whole). However, it is actually better to use only the number of respondents who answered the survey questions where tools A and B occurred as answers.

People who didn’t answer both question cannot possibly have indicated using both tools A and B. In addition, the probability that at least x people are found to use tools A and B together is lower in a large total population than in a small population. This means that the larger the population, the smaller the number of respondents using both tools needs to be for that number to be considered significant. Thus, excluding people that did not answer both questions (and thereby looking at a smaller population) sets the bar higher for two tools to be considered preferentially used together.

Choosing the p-value threshold
The other consideration in applying the hypergeometric test to our survey data is what p-value to use as a cut-off point for significance. As said above, in a single experiment, a result with a p-value lower than 0.05 is commonly considered significant. However, with multiple comparisons (in this case: when a large number of tool combinations is tested in the same dataset), keeping the same p-value will result in an increased number of false-positive results (in this case: tools incorrectly identified as preferentially used together).

The reason is that a p-value of 0.05 indicates there is a 5% chance the observed result is due to chance.  With many observations, there will be inevitably be more results that may seem positive, but are in reality due to chance.

One possible solution to this problem is to divide the p-value threshold by the number of tests  carried out simultaneously. This is called the Bonferroni correction. In our case, where we looked at 119 tools (7 preset answer options for 17 survey questions) and thus at 7,021 unique tool combinations, this results in a p-value threshold of 0.0000071.

Finally, when we not only want to look at tools used more often together than expected by chance, but also at tools used less often together than expected, we are performing a 2-tailed, rather than a 1-tailed test. This means we need to halve the p-value used to determine significance, resulting in a p-value threshold of 0.0000036.

Ready, set, …
Having made the decisions above, we are now ready to apply the hypergeometric test to our survey data. For this, we need to know for each tool combination (e.g. tool A and B, mentioned as answer options in survey questions X and Y, respectively):

a) the number of people that indicate using tool A
b) the number of people that indicate using tool B
c) the number of people that indicate using both tool A and B
d) the number of people that answered both survey questions X and Y (i.e. indicated using at least one tool (including ‘others’) for activity X and one for activity Y).

These numbers were extracted from the cleaned survey data either by filtering in Excel (a,b (12 MB), d (7 MB)) or through an R-script (c, written by Roel Hogervorst during the Mozilla Science Sprint.

The cumulative probability function was calculated in Excel (values and calculations) using the following formulas:

=1-HYPGEOM.DIST((c-1),a,b,d,TRUE)
(to check for tool combination used together more often than expected by chance)

and
=HYPGEOM.DIST(c,a,b,d,TRUE)
(to check for tool combination used together less often than expected by chance)

excel-sucks

Figure 3 – Twitter

Bonferroni correction was applied to the resulting p-values as described above and conditional formatting was used to color the cells. All cells with a p-value less than 0.0000036 were colored green or red, for tools used more or less often together than expected by chance, respectively.

The results were combined into a heatmap with green-, red- and non-colored cells (Fig 4), which can also be found as first tab in the Excel-files (values & calculations).

[Update 20170820: we now also have made the extended heatmap for all preset answer options and the 7 most often mentioned ‘others’ per survey question (Excel files: values & calculations)]

heatmap-2-tailed-at-a-glance

Figure 4 Heatmap of tool combinations used together more (green) or less (red) often than expected by chance (click on the image for a larger, zoomable version).

Pretty colors! Now what?
While this post focused on methodological aspects of identifying relevant tool combinations, in future posts we will show how the results can be used to identify real-life research workflows. Which tools really love each other, and what does that mean for the way researchers (can) work?

Many thanks to Bastian Greshake for his helpful advice and reading of a draft version of this blogpost. All errors in assumptions and execution of the statistics remain ours, of course 😉 

GitHub and more: sharing data & code

A recent Nature News article ‘Democratic databases: Science on GitHub‘ discussed GitHub and other programs used for sharing code and data. As a measure for GitHub’s popularity, NatureNews looked at citations of GitHub repositories in research papers from various disciplines (source: Scopus). The article also mentioned BitBucket, Figshare and Zenodo as alternative tools for data and code sharing, but did not analyze their ‘market share’ in the same way.

Our survey on scholarly communication tools asked a question about tools used for archiving and sharing data & code, and included GitHub, FigShare, Zenodo and Bitbucket among the preselected answer options (Figure 1). Thus, our results can provide another measurement of use of these online platforms for sharing data and code.

sharedata

Figure 1 – Survey question on archiving and sharing data & code

Open Science  – in word or deed

Perhaps the most striking result is that of the 14,896 researchers among our 20,663 respondents (counting PhD students, postdocs and faculty), only 4,358 (29,3%) reported using any tools for archiving/sharing data. Saliently, of the 13,872 researchers who answered the question ‘Do you support the goals of Open Science’ (defined in the survey as  ‘openly creating, sharing and assessing research, wherever viable’), 80,0% said ‘yes’. Clearly, for open science, support in theory and adoption in practice are still quite far apart, at least as far as sharing data is concerned.

os-support-researchers

Figure 2 Support for Open Science among researchers  in our survey

Among those researchers that do archive and share data, GitHub is indeed the most often used, but just as many people indicate using ‘others’ (i.e. tools not mentioned as one of the preselected options). Figshare comes in third, followed by Bitbucket, Dryad, Dataverse, Zenodo and Pangaea (Figure 3).

all-researchers-sharing-data

Figure 3 – Survey results: tools used for archiving and sharing data & code

Among ‘others’, the most often mentioned tool was Dropbox (mentioned by 496 researchers), with other tools trailing far behind.  Unfortunately, the survey setup invalidates direct comparison of the number of responses for preset tools and tools mentioned as ‘others’ (see: Data are out. Start analyzing. But beware). Thus, we cannot say whether Dropbox is used more or less than GitHub, for example, only that it is the most often mentioned ‘other’ tool.

Disciplinary differences

As mentioned above, 29,3% of researchers in our survey reported to engage in the activity of archiving and sharing code/data. Are there disciplinary differences in this percentage? We explored this earlier in our post ‘The number games‘. We found that researchers in engineering & technology are the most inclined to archive/share data or code, followed by those in physical and life sciences. Medicine, social sciences and humanities are lagging behind at more or less comparable levels (figure 4). But is is also clear that in all disciplines archiving/sharing data or code is an activity that still only a minority of researchers engage in.

data-code-archiving-respons-researchers

Figure 4 – Share of researchers archiving/sharing data & code

Do researchers from different disciplines use different tools for archiving and sharing code & data? Our data suggest that they do (Table 1, data here). Percentages given are the share of researchers (from a given discipline) that indicate using a certain tool. For this analysis, we looked at the population of researchers (n=4,358) that indicated using at least one tool for archiving/sharing data (see also figure 4). As multiple answers were allowed for disciplines as well as tools used, percentages do not add up to 100%.

While it may be no surprise that researchers from Physical Sciences and Engineering & Technology are the most dominant GitHub users (and also the main users of BitBucket), GitHub use is strong across most disciplines. Figshare and Dryad are predominantly used in Life Sciences, which may partly be explained by the coupling of these repositories to journals in this domain (i.e. PLOS to Figshare and Gigascience, along with many others, to Dryad).

github-and-more-heatmap-table

Table 1: specific tool usage for sharing data & code across disciplines

As a more surprising finding, Dataverse seems to be adopted by some disciplines more than others. This might be due to the fact that there is often institutional  support from librarians and administrative staff for Dataverse (which was developed by Harvard and is in use at many universities). This might increase use by people who have somewhat less affinity with ‘do-it-yourself’ solutions like GitHub or Figshare. An additional reason, especially for Medicine, could be the possibility of private archiving of data in Dataverse, with control over whom to give access. This is often an important consideration when dealing with potentially sensitive and confidential patient data.

Another surprising finding is the overall low use of Zenodo – a CERN-hosted repository that is the recommended archiving and sharing solution for data from EU-projects and -institutions. The fact that Zenodo is a data-sharing platform that is available to anyone (thus not just for EU project data) might not be widely known yet.

A final interesting observation, which might go against the common idea, is that among researchers in Arts&Humanities who archive and share code, use of these specific tools is not lower than in Social Sciences and Medicine. In some cases, it is even higher.

A more detailed breakdown, e.g. across research role (PhD student, postdoc or faculty), year of first publication or country is possible using the publicly available survey data.

The number games

In our global survey on innovations in scholarly communication, we asked researchers (and people supporting researchers, such as librarians and publishers) what tools they use (or, in the case of people supporting researchers, what tools they advise) for a large number of activities across the research cycle. The results of over 20,000 respondents, publicly available for anyone analyze, can give detailed information on tool usage for specific activities, and on what tools are preferentially used together in the research workflow. It’s also possible to look at results for different disciplines, research roles, career stages and countries specifically.

But we don’t even have to dive into the data at the level of individual tools to see interesting patterns. Focusing on the number of people that answered specific questions, and on the number of tools people indicate they use (regardless of which tools that are) already reveals a lot about research practices in different subsets of our (largely self-selected) sample population.

Number of respondents
In total, we received 20,663 responses. Not all respondents answered all questions, though. The number of responses per activity could be seen to reflect whether that activity plays a role in the research workflow of respondents, or at least, to what extent they use (or advise) concrete tools to carry out that activity (although we also included all answers like ‘manually’, ‘in person’ etc).
On methodology

For each question on tool usage, we offered seven preselected choices that could be clicked (multiple answers allowed), and an ‘and also others’ answer option that, when clicked, invited people to manually enter any other tools they might use for that specific research activity (see Figure 1).

outreach-small

Figure 1 – Example question with answer options

We did not include a ‘none’ option, but at the beginning of the survey stated that people were free to skip any question they felt did not apply to them or did not want to answer. Nonetheless, many people still answered ‘none’ (or any variation thereof) as their ‘other’ options.

Since methodologically, we cannot make a distinction between people who skipped a question or who answered ‘none’, we removed all ‘none’ answers from the survey result. We also adjusted the number of respondents that clicked the ‘and also other’ option to only reflect those that indicated they used at least one tool for the specific research activity (excluding all ‘nones’ and empty answers).

Figure 2 shows the percentage of respondents that answered each specific research activity question, both researchers (PhD students, postdocs and faculty) and librarians. The activities are listed in the order they were asked about, illustrating that the variation in response rate across questions is not not simply due to ‘survey fatigue’ (i.e. people dropping out halfway through the survey).

Respondents per activity (cycle order)

Figure 2 – Response rate per survey question (researchers and librarians)

What simple question response levels already can tell us

The differences in response levels to the various questions are quite marked, ranging from barely 15% to almost 100%. It is likely that two effects are at play here. First, some activities are relevant for all respondents, e.g. writing and searching information, while others like sharing (lab) notebooks are specific to certain fields, explaining lower response levels. Second, there are some activities that are not yet carried out by many or for which respondents choose not to use any tool. This may be the case with sharing posters and presentations and with peer review outside that organized by journals.

Then there are also notable differences between researchers and librarians. Researchers expectedly more often indicate tool usage to publish and librarians are a bit more active in using or advocating tools for reference management. Perhaps more interestingly, it is clear that librarians are “pushing” tools that support sharing and openness of research.

The differences in response levels to the various questions are quite marked, ranging from barely 15% to almost 100%. Some activities seem relevant for all respondents, e.g. writing and searching information. Others, like sharing (lab) notebooks, sharing posters and presentations and peer review outside that organized by journals, may be carried out by . fewer people, or may be done without using specific tools.
Then there are also notable differences between researchers and librarians. As expected, researchers more often indicate tool usage to publish and librarians are a bit more active in using or advocating tools for reference management and selection of journals to publish in. Perhaps more interestingly, it is clear that librarians are “pushing” tools that support sharing and openness of research.

Disciplinary differences
When we look at not just the overall number of respondents per activity, but break that number down for the various disciplines covered (Figure 3), more patterns emerge. Some of these are expected, some more surprising.

Respondents per activity per discipline (researchers)

Figure 3 – Response rate per survey question across disciplines (researchers only)

As expected, almost all respondents, irrespective of discipline, indicate using tools for searching, getting access, writing and reading. Researchers in Arts & Humanities and Law report lower usage of analysis tools than those in other disciplines, and sharing data & code is predominantly done in Engineering & Technology (including computer sciences). The fact that Arts & Humanities and Law also score lower on tool usage for journal selection, publishing and measuring impact than other disciplines might be due to a combination of publication culture and the (related) fact that available tools for these activities are predominantly aimed at journal articles, not books.

Among  the more surprising results are perhaps the lower scores for reference management for Arts & Humanities and Law (again, this could be partly due to publication culture, but most reference management systems enable citation of books as well as journals). Scores for sharing notebooks and protocols were low overall, where we would have expected this activity to occur somewhat more often in the sciences (perhaps especially life sciences). Researchers in Social Sciences & Economics and in Arts & Humanities relatively often use tools to archive & share posters and presentations and to do outreach (phrased in the survey as: “tell about your research outside academia”), and interestingly enough, so do researchers in Engineering & Technology (including computer science). Finally, peer review outside that done by journals is most often done in Medicine, which is perhaps not that surprising given that many developments in open peer review are pioneered in biomedical journals such as The BMJ and BioMedCentral journals.

You’re using HOW many tools?

How many apps do you have on your smartphone*? On your tablet? Do  you expect the number of online  tools you use in your daily life as a researcher to be more or less than that?

Looking at the total number of tools that respondents to our survey indicate they use in their research workflow (including any ‘other’ tools mentioned, but excluding all ‘nones’, as described above), it turns out the average number of tools reported per person is 22 (Figure 4). The frequency distribution curve is somewhat skewed as there is a longer tail of people using higher numbers of tools (mean = 22.3; median = 21.0).

Frequency distribution of number of tools (including others) mentioned by researchers (N=14,896)

Figure 4 – Frequency distribution of total number of tools used per person (20,663 respondents)

We also wondered whether the number of tools a researcher uses varies with career stage (e.g. do early career researchers use more tools than senior professors?).

Figure 5 shows the mean values of the number of tools mentioned by researchers, broken down by career stage. We used year of first publication as a proxy for career stage, as it is a more or less objective measure across research cultures and countries, and less likely to invoke ‘refuse to answer’ then asking for age might have been.

Number of tools by year of first publication (researchers)

Figure 5 – Number of tools used across career stage (using year of first publication as proxy)

There is an increase in the number of tools used going from early to mid career stages; peaking for researchers who published their first paper 10-15 years ago. Conversely, more senior researchers seem to use less tools, with the number of tools decreasing most for researchers who first published over 25 years ago.  The differences are fairly small, however, and it remains to be seen whether they can be proven to be significant. There also might be differences across disciplines in these observed trends,  depending on publication culture within disciplines. We have not further explored this yet.

It will be interesting to correlate career stage not only with the number of tools used, but also with type of tools: do more senior researchers use more traditional tools that they have been accustomed to using throughout their career, while younger researchers gravitate more to innovative or experimental tools that have only recently become available? By combining results from our survey with information collected in our database of tools, these are the type of questions that can be explored.

Mozilla Science Lab Global Sprint 2016 – getting started with analysis

mozillasprint2016

On June 2-3 between 9:00-13:00, we want to bring a group of smart people together in Utrecht to kickstart the analysis of our survey data. This event will be part of the Mozilla Science Lab Global Sprint 2016.

What is Mozilla Science Lab?
Mozilla Science Lab is a community of researchers, developers, and librarians making research open and accessible and empowering open science leaders through fellowships, mentorship, and project-based learning.

What is the Global Sprint?
This two-day sprint event brings together researchers, coders, librarians and the public from around the globe to hack on open science and open data projects in their communities. This year, it has four tracks anyone can contribute to: tools, citizen science, open educational resources and open data. There are about 30 locations participating in this year’s sprint – our event in Utrecht is one of them.

What will we do during the sprint?
Quick exploration of the survey results can be done in an interactive dashboard on Silk (http://dashboard101innovations.silk.co), but many more in-depth analyses are possible. Some examples can already been found on Kaggle. During this Mozilla Science Lab Sprint, we intend to make a head-start with these analyses by bringing together people with expertise in numerical and textual analysis.

The survey results can provide insights into current practices across various fields, research roles, countries and career stages, and can be useful for researchers interested in changing research workflows. The data also makes it possible to correlate research tool usage to stance on Open Access and Open Science, and contains over 10,000 free-text answers on what respondents consider the most important developments in scholarly communication.

So: two half-days (mornings only) of coding/hacking t0 discover patterns, make connections and get information from our data. If you have ideas of your own on what to do with our data, or want to help us realize our ideas, join us! You bring your laptop and your mind, we supply a comfortable space, 220V, coffee, WiFi and something healthy (or less so) to eat – and of course, the data to work with!

You can join us on either of these days or both days if you like. On both days there will be a short introduction to get people started. Ideally the first day will result in some analyses/scripts that participants can build on during the second day.

Who can join?
We invite all smart people, but especially those with experience in e.g. R, Python, Google Refine, NVIVO or AtlasTI. Any and all ideas for analysis are welcome!

You can register here, or just contact us to let us know you’re coming.

Where? When?
The sprint will take place on June 2-3 on the Uithof in Utrecht, either in the Utrecht University Library building, or another space close by.

Please note that the sprint will take place between 9:00-13:00 on both days. Participants are of course free to continue working after these hours, and online support will be given wherever possible.

mozillasprint2016-Utrechtmap